Scatter Chart
Advertisement
Grapholic
Grapholic is an excellent tool to create high quality graphs easily and quickly. The software supports multiple graph types, and allows you to import data from SQL Server, Oracle, Access database, XLS and CSV files and even enter data manually. You get
Advertisement
GraphSoftware
This graph tool allows you to make a graph by importing data from various data sources like excel, csv, oracle, mssql, access. you can modify the graphs with a built in canvas. Save the graphs in png,jpg,pdf format.Generate one click graph later by saving
C v.9.0
This graph tool allows you to make a graph by importing data from various data sources like excel, csv, oracle, mssql, access. you can modify the graphs with a built in canvas. Save the graphs in png,jpg,pdf format.
Animated Chart Pro - Flash Chart Software
Animated Chart creates dynamic flash charts to publish them to web sites. All items and structures of flash charts are customizable with clicking the chart preview. Select a flash chart type: Area, Bar, Bubble, Column, Doughnut, Line, Pie, Scatter, Radar,
Animated Chart Pro v.2.2.1
XML Flash charts allows your to display live data on your website. Animated Chart Pro lets to create and customize XML-driven dynamic flash chart and publish it to website. Area, Bar, Bubble, Column, Doughnut, Line, Pie, Scatter, Radar, Stock charts.

Aspose.Chart for .NET
Aspose.Chart is a .NET charting component that can create more than 20 chart types like: area, bar, doughnut, line, pie, point, step, bubble, candlestick, cube, curve, CurveArea, gantt, scatter, contour, HighLowClose, OpenHighLowClose and pareto chart
NextwaveSoft WPF Suite Chart and Gauge
Nextwave Software WPF Suite with WPF Chart and Gauge is a component suite that helps you to visualize your data in Windows Presentation Foundation applications. The suite contains more than 40 2D/3D charts, such as area, bar, column, line, pie, doughnut,

Swiftchart: chart and graph java application v1_60 v.1.0
Chart java applet software to generate dynamic charts and graphs within JSP, servlets or java applications - bar, line, pie, stacked and grouped charts in 2D and 3D with a wide range of parameters and chart types. Main features: Charts in 2D/3D,
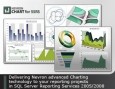
Nevron Chart for SSRS 2009_Vol.1 v.1.0
Nevron Chart for SQL Server Reporting Services (SSRS) is an advanced report item, which delivers a complete set of 2D and 3D charting types, highly customizable axes, tight data integration and unmatched visual effects to your reports.
Swiftchart: chart, graph java applet v2_20 v.1.0
Chart java applet software to generate dynamic charts and graphs - bar, line, pie, stacked and grouped charts in 2D and 3D with a wide range of parameters and chart types. Main features: Charts in 2D/3D, Anti aliasing, Multi language support, Cross
Nevron Chart for .NET v.2016.1
Nevron Chart for .NET is a professional charting component for .NET, featuring numerous business, scientific and financial charting types, gauges, VS design time support, AJAX support, built-in toolbar, flexible axes, and much more.